Geographic Information System (GIS) Models:
Background
A data model in geographic information
systems is a mathematical construct for representing geographic objects or
surfaces as data. For example, the vector data model represents geography as
collections of points, lines, and polygons and the raster data model represent
geography as cell matrixes that store numeric values.
[1]
Raster Model
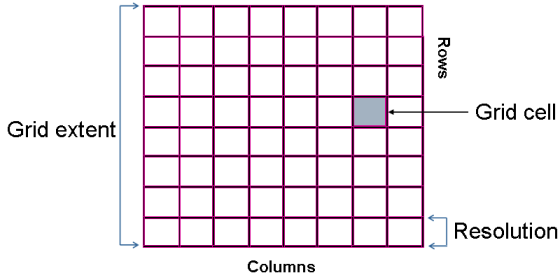
The raster data model is an abstraction of the real world
where the basic unit of data (points, lines and areas) is represented using a
matrix of cells or 'pixels'. The raster model uses the grid-cell data structure
where the geographic area is divided into cells identified by rows and columns.
The following information must be known when using raster data
- Grid extent (number of rows and columns)
- Grid resolution (size of grid cell)
- Georeferencing information (e.g. corner coordinates)
In the simplest form, each cell contains a value for the
element. Any cell not containing a feature would have the value of "0". In more
sophisticated systems, the cell value is a label that links to the record as an
attribute
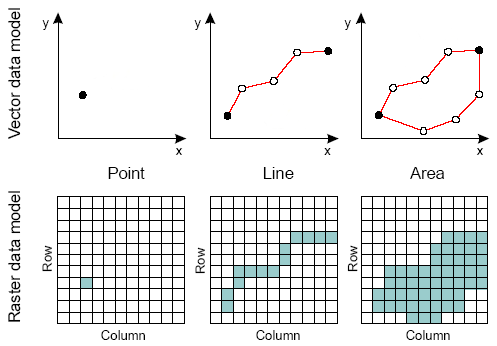
Vector Model
- A point is defined by a single pair of coordinate
values. A point normally represents a geographic feature that is too small
to be represented as a line or area. For example, a port, a dock, or a
hatchery can be represented as a point depending on the scale of the map on
which it is be shown.
- A line is defined by an ordered list of coordinate pairs
defining the points through which the line is drawn. Linear feature include
contour lines, ship tracks and streams. At most mapping scales these
features will retain their linear form, although the degree of detail and
generalisation will vary with scale. A line is synonymous with an arc.
- An area is defined by the lines that make up its
boundary. Areas are also referred to as polygons. Examples include ocean
basins, lagoons, mangroves, lakes, etc. When shown on maps at a very small
scale these features may also eventually become points.
Comparison of
Raster and Vector Methods
Advantages and Disadvantages
There are several advantages and disadvantages for using
either the raster or vector data structure to store spatial data. These are
summarized below:
- Raster Model
- Advantages
- Simple data structure
- Efficient for remotely sensed or scanned data
- Simple spatial analysis procedures
- Disadvantages
- Requires greater storage space on computer
- Depending on pixel size, graphical output may be
less pleasing
- Projection transformations are more difficult
- More difficult to represent topological
relationships
- Vector Model
- Advantages
- Data can be represented in its original
resolution without generalisation
- Requires less disk storage space
- Topological relationships are readily maintained
- Graphical output more closely resembles
hand-drawn maps
- Disadvantages
- More complex data structure
- Inefficient for remotely sensed data
- Some spatial analysis procedures are complex and
process intensive
- Overlaying multiple vector maps is often time
consuming

